Pros
- Covers both price drops and yield losses — pays on whichever causes more revenue loss
- Uses the higher of projected or harvest price, so your guarantee can increase after planting
- Holds approximately 75% market share — the most popular crop insurance policy for a reason
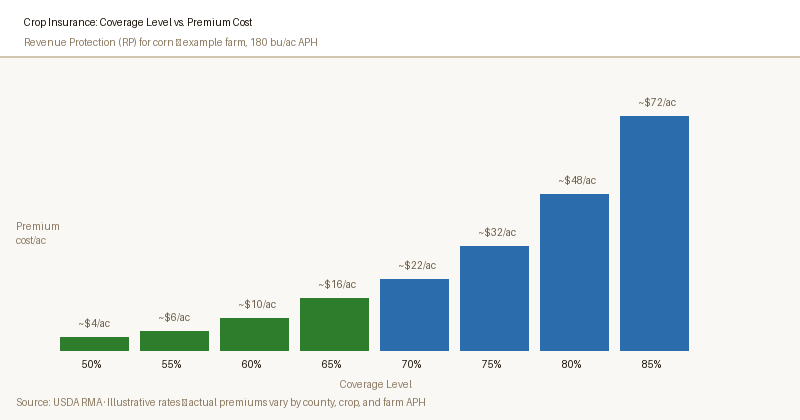
- Premium subsidy of 38–55% at the most common coverage levels (75–85%)
- Paired with enterprise units, RP becomes the most cost-effective comprehensive coverage
Cons
- Higher premiums than Yield Protection or RP-HPE at every coverage level
- Projected price is set from February futures — if prices are low in February, your guarantee starts lower
- Does not cover quality losses or prevented planting at the same rate as the main policy
- APH (Actual Production History) yield history limits your coverage — low-yield years permanently reduce your baseline
- Coverage caps at 85% — you always carry at least a 15% deductible
Who This Is For
Row crop farmers growing corn, soybeans, wheat, or cotton who want the broadest revenue protection available. RP is the right choice when price risk and yield risk both matter — which is most years for most operations.
— USDA Risk Management Agency — Revenue Protection Fact Sheet
Who Should Look Elsewhere
Farmers who are confident prices will hold or rise should consider RP-HPE (Harvest Price Exclusion) for lower premiums. Diversified farms with 3+ commodities should evaluate WFRP (Whole-Farm Revenue Protection) instead of individual RP policies.
The Core Difference: What Happens When Prices Drop
Watch this USDA explainer video:
The fundamental distinction between RP and YP only matters in one scenario: when commodity prices at harvest are lower than they were at planting.
In all other scenarios — good yields and prices, or yield loss with stable prices — both policies pay very similarly.
Here's the critical insight: RP uses the higher of the projected price or the harvest price to calculate your indemnity. YP uses only the projected price. If corn falls from $5.00 at planting to $4.00 at harvest, RP calculates your guarantee using $5.00.
YP also uses $5.00 in its revenue guarantee calculation — but if you have a yield shortfall, the loss is measured using the lower $4.00 harvest price, which means a smaller indemnity check.
Full Comparison: RP vs. RP-HPE vs. YP
| Feature | Revenue Protection (RP) | RP with Harvest Price Exclusion | Yield Protection (YP) |
|---|---|---|---|
| Covers yield loss | Yes | Yes | Yes |
| Covers price decline | Yes | No | No |
| Price used for indemnity | Higher of projected or harvest price | Projected price only | Projected price only |
| Revenue guarantee set using | Projected price × APH × coverage level | Projected price × APH × coverage level | Projected price × APH × coverage level |
| Indemnity if yield falls AND price drops | Calculated using higher price — larger payout | Calculated using projected price — same as YP | Calculated using projected price — smaller payout |
| Premium cost | Highest | Medium | Lowest |
| % of farmers choosing (corn/soybeans) | ~65% | ~10–15% | ~20–25% |
| Best for | Most situations — especially volatile price environments | Stable-price crops with yield risk | When prices are unlikely to decline; budget-conscious |
How Revenue Protection Indemnity Is Calculated
Understanding the RP indemnity formula is the key to understanding why most farmers choose it. Here's a worked example for a corn producer:
RP Indemnity Example — Corn, 500 acres
-
1APH yield: 200 bu/ac · Coverage level: 85% · Projected price: $5.00/bu
-
2Revenue guarantee = 200 × 85% ×
$5.00 = $850 per acre -
3Actual harvest: 150 bu/ac · Harvest price: $4.00/bu
-
4Actual revenue = 150 ×
$4.00 = $600 per acre -
5RP indemnity =
$850guarantee − $600 actual = $250 per acre × 500 acres = $125,000
$125,000How Yield Protection Indemnity Works
Using the same scenario with YP, the calculation works differently:
YP Indemnity Example — Same Farm, Same Year
-
1APH: 200 bu/ac · Coverage: 85% · Projected price: $5.00/bu
-
2Yield guarantee = 200 × 85% = 170 bu/ac
-
3Actual yield: 150 bu/ac (20 bu/ac shortfall)
-
4YP indemnity = (170 − 150) × projected price $5.00 =
$100/ac × 500 ac = $50,000
$50,000$75,000$125,000. YP paid $50,000. The $75,000 difference comes entirely from RP using the $5.00 projected price (not the $4.00 harvest price) when calculating the revenue guarantee. In a year when prices fall AND yields fall — which often happens together — RP's advantage is largest.Premium Cost Comparison
RP costs more than YP because it provides more coverage. The exact difference varies by crop, county, and coverage level, but for a representative 500-acre corn operation in central Illinois at 80% coverage:
| Policy Type | Estimated Gross Premium | USDA Subsidy (52%) | Farmer's Net Premium |
|---|---|---|---|
| Revenue Protection (RP) | ~$38,000 | ~$19,760 | ~$18,240 |
| RP with HPE | ~$31,000 | ~$16,120 | ~$14,880 |
| Yield Protection (YP) | ~$25,000 | ~$13,000 | ~$12,000 |
Illustrative estimates based on 2026 actuarial data for central Illinois corn. Actual premiums vary significantly by county, APH, and current commodity prices. Get a precise quote from your agent.
When to Choose Each Policy
Choose RP When...
- Commodity prices are volatile or uncertain
- You want full protection against both price and yield risk
- Your lender requires comprehensive coverage
- You're farming corn and soybeans in the Corn Belt
- You cannot absorb a large income shortfall in a down-price year
Choose RP-HPE When...
- You want to save some premium vs. full RP
- You price grain at planting (marketing contracts lock in price)
- Commodity prices are historically stable for your crop
- You want yield coverage without paying for full revenue protection
Choose YP When...
- Minimizing premium cost is a priority
- You're growing a crop where prices rarely decline at harvest
- You have forward contracts covering most of your expected production
- Local crop insurance agent recommends it for your specific crop/county
Talk to a Crop Insurance Agent About RP vs. YP
The right policy type depends on your specific crop, county, APH, and marketing strategy. A USDA-approved agent can run actual premium quotes for both options and help you decide.
Find an Agent at RMA (Risk Management Agency) →AcreCompass does not sell crop insurance and earns no commission on policy purchases.
Frequently Asked Questions
What is the "projected price" and how is it set?
If harvest prices rise above projected, does RP pay more?
Can I switch between RP and YP each year?
Does my lender care which policy I choose?
What if I have a forward contract at a higher price — does RP still make sense?
How does RP compare to buying a put option on futures?
Sources
- USDA Risk Management Agency — Policy Types and Coverage
- USDA RMA — Summary of Business by Program, 2024 Crop Year
- USDA RMA — Revenue Protection Policy Provisions
- University of Illinois Extension — Crop Insurance: RP vs. YP, 2025